Retailer A
has a bigger ad budget. Retailer B uses more
digital media. Which one gets better returns?
I recently took the time to observe and evaluate the marketing efforts of two companies in different towns. Both sell to similar populations, have comparable occupancy rates and similar competitive environments.
Both Retailer A and Retailer B operate stores in decent retail locations. They are similar in many ways, however, their marketing approaches are very different.
Marketing Approaches
Since Retailer B spent much less, and sold a
bit more, it produced
a $7.44 marketing
ROI versus $3.95 for Retailer A. |
Retailer A is highly promotional, advertising heavily across many media channels including TV, radio, digital media, and direct mail. Salespeople do little prospecting on their own with past customers.
Retailer B purchases very little television, radio advertising, or direct mail. It invests a large proportion of its marketing budget in digital media. Retailer B's salespeople are required to perform extensive follow-up with customers.
I decided to look at these businesses side by side under several marketing related metrics to compare the effectiveness of their approaches.
Most retailers' marketing efforts are undertaken for the purpose of communicating to a large target audience to generate store traffic and sales leads. The purpose of sales is to communicate effectively with customers to generate revenue for the organization.
The more traffic and leads a furnishings store's marketing efforts can produce from a certain budget, the more revenue a company can generate, right? Maybe, maybe not. Ultimate results depend on how well they convert traffic to sales.
Through comparing Company A and B, I will suggest some marketing metrics to track, analyze results, and suggest some improvements.
For the purpose of this article, traffic is broken down into three customer segments: new customers, repeat customers, and be-back customers. A be-back customer is defined here as the personal trade customers of an individual salesperson who returns after a first visit.
Store traffic was segmented in this way due to the difficulties of tracking traffic by a single media type. Real-world customers may engage with one or a variety of media, so any individual customer can decide to visit a store based on exposure to one or multiple ad types. Please note that online traffic is not being considered in this article, as that analysis requires a separate set of analytics.
Crunching The Numbers
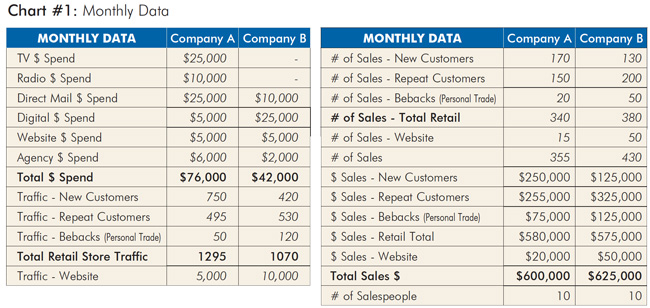
Advertising media spend, customer traffic proportions, salesperson handling of that traffic, conversion rates, average sale, revenue per guest, cost of the traffic and the return on the advertisement investment were considered in the following analysis.
After crunching the monthly data numbers presented in Chart #1, similarities and differences were identified in the marketing results produced by each retailer.
At 13 percent of sales, advertising expense
is higher than most operations. In this case, Retailer A has a good location, so it may
be unnecessarily
overspending. |
Similarities
Sales Volume: For the month, the sales volume produced was very close at $600,000 and $625,000. Both companies produced this volume with the same number of salespeople, 10.
Conversion Rate by Customer Type: Companies A and B both have the highest close rate in customers who have shopped with them before. New customers have a lower close rate.
Average Sale by Type of Customer: Both have the highest average sale in repeat customers and be-backs.
Sales Per Guest by Customer Type: The revenue produced for customers who are “asking for salespeople by name”, due to personal trade, is the most profitable traffic. The next most profitable are repeat customers who have shopped there before at some point.
Differences
Retailer B made more sales from less retail
traffic and thus produced a much higher close rate at 36% versus 26% for Retailer A. |
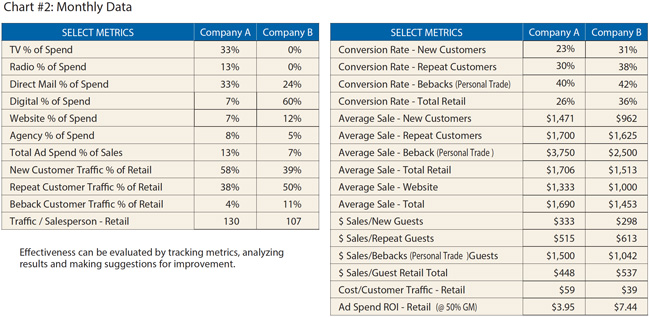
Percent of Media Spend: As mentioned earlier, Retailer A advertises heavily with traditional media, while Retailer B spends more of its budget on digital media. Retailer A spent a much larger amount on advertising at 13 percent of sales, while Retailer B spent 7 percent.
Total Traffic: Retailer A produced more in-store visits than Retailer B, while Retailer B produced more website visits.
Traffic handled by each salesperson on average: Retailer A handled 130 customers on average while Retailer B averaged 107 per person. It is important to staff to the level that your business model dictates. In the furniture industry, traffic handled by each salesperson on average ranges from 80 to 200, with design oriented operations being on the lower side.
Retail conversion rate: Retailer B made more sales from less retail traffic and thus produced a much higher close rate at 36 percent versus 26 percent for Retailer A.
Retail average sale: Retailer A produced a higher average sale than Retailer B primarily because it was better at producing a higher sales volume from new customers. $1,471 versus $962.
Cost per total retail traffic: Retailer A spends much more to bring customers into their operation at $59 per customer, versus $39 at Retailer B.
Return On Investment
The return on investment of advertising is higher at Retailer B. The Advertising ROI formula is: Gross Margin Dollars Produced / Total Cost of Advertising. Both operations had a similar gross margin percent. Since Retailer B spent much less, and sold a bit more, it produced a $7.44 marketing ROI versus $3.95 for Retailer A.
In the furniture industry,
traffic handled by each salesperson on average ranges from 80 to 200, with design oriented operations being on the lower side.
Recommendations
Every business situation is different. There is no perfect model. Everyone has areas of strength and areas of weakness. As a result, opportunity is always present if you can find it and know how to improve upon it. In this comparison, three top areas for improvement for each company were identified as outlined below.
Retailer A
1. Decrease Ad spend and change Ad mix: At 13 percent of sales, advertising expense is higher than most operations in our industry. In this case, Retailer A has a good location, so it may be unnecessarily overspending. They should look at tweaking their media spend and mix to see if a similar amount of traffic can be produced with a budget of under 10 percent of sales to start.
2. Improve close rate: Retailer A may be able to improve its close rate for new customers. It has proven that it can get a decent average sale from new customers and a higher close rate from repeat customers (see Charts). Even a couple of percentage points increase in close rate would have a significant impact on sales.
3. Focus on increasing repeat customers: In both companies, all metrics point to the fact that repeat customers and personal trade customers are the most profitable. Retailer A is poor at follow-up and prospecting. This is a huge opportunity for them.
Retailer B
1. Increase average sale: There is no reason why Retailer B should have a low average sale. It gets decent repeat business, follows up well and has an excellent close rate. Like all businesses, it should examine its salespeople individually under these metrics, but put extra focus on the average sale for new customers. Likely there are things Retailer B can do to increase average sale by improving processes and/or people.
There is no reason why Company B should have a low average sale. It gets decent repeat business, follows-up
well and has an
excellent close rate. |
2. Seek ways to generate new customer volume: If Retailer B can fix its average sale challenge with new customers, it will benefit from working to increase new customer traffic. This might be achieved by changing the media message and/or mix. Or, perhaps it might implement a customer referral program to build on its base of loyal customers.
3. Focus on increasing repeat customers: All businesses can benefit from improving relationships with past customers. In the furniture industry, it is common for advertisers to choose to increase their budgets rather than putting the time and effort into staying in touch with existing customers. Customers are easier to convert than "prospects", so I recommend continuing to develop this stream of revenue from past customers.
After reviewing this case study, consider doing a marketing assessment on your operation using these or other metrics. You will likely find similarities and differences between your operation and Retailers A and B. Marketing is a big business expense and critical to your business success. It is, therefore, worth digging into the metrics and then tweaking your program occasionally. Bottom-line, seek to understand your situation better, then try to improve it. Learning from others and adapting best practices are important, but improving your unique situation is what matters in the end.