
Only about one in thirty independent furniture store owners produces an annual budget and knows how to use it to get the business outcomes they desire.
In corporate America, budgets are typically required to be completed by mid-November. The budgets I prepared working for major players in the furniture industry before founding JRM Sales & Management were typically sent to a direct supervisor, edited by an executive team, then passed on to a board of directors. Budgets then worked their way back to me through the chain of command by the end of December. They included tremendous detail on advertising and payroll, including monthly advertising plans with promotions and advertising budget forecasts for each media choice. The payroll plan included projected new-hires, raises and bonuses.
Before the end of each month I was required to report expected net profit, gross revenue and gross margin. If these expectations were off by more than two or three percent, I knew that I would be held accountable.
Why Make A Budget?
A budget facilitates accountability tied to key measurements. With a budget in place you can easily see actual performance-to- budget monthly, or even more frequently. When you don't achieve a profit goal, the budget will help you drill down to understand what happened. It could be that some significant invoice came in a month late and impacted your bottom line. If it’s not a timing issue or unexpected one-time cost, then checking your budget numbers will help you to make necessary adjustments, so going forward, your probability of success will be significantly increased.
Positive Outcomes
How do you use a budget to engineer positive outcomes? A budget should be thought of as a series of goals leading to an ultimate goal of net profit. Budgets are forward-looking. Relying on last month’s profit and loss statement or last year’s tax return will not provide that for you. Not having a budget is like driving your car while looking into your rear-view mirror. Sooner or later it is not going to end well.
I am not going to tell you that developing and utilizing a budget is the easiest thing in the world, but it isn't that hard either. Hard was starting your business. Hard was figuring out ways to work with family members. Hard was holding on when times were tough. Hard was selling your concept to lenders and vendors. Hard is running your business from your checkbook!
Avoid The Death Spiral
To some degree, most businesses experience significant variations in sales, profits and cash-flow. Forecasting, an essential practice in well-run furniture operations, is part science and part art. Even for businesses that make some attempt at budgeting, it’s not unusual during severe downturns for numbers to be so far off that owners just give up. Missing forecasts is frustrating. Not forecasting can lead to a death spiral.
At the top of a death spiral, business are not being managed as well as they should be, but things are still okay. Then something goes wrong. A key employee is lost, a strong competitor moves in, or there’s a downturn in the economy. At first a retailer may hardly notice that his or her business is starting to deteriorate. As business conditions worsen, owners frantically look to cut costs such as sales payroll, advertising or training. Unfortunately, in most cases, these are the last items that should be cut because they are the things that lead to revenue productivity. Frantically cutting costs is like pulling the plug on a tub full of water. At first, it’s hard to notice anything, and then it quickly goes down the drain.
Frantically cutting costs is like pulling the plug on a tub full of water.
At first, it’s hard to notice anything, and then it quickly goes down the drain.
The Sales Curve Is A Good Place To Start
How should you determine your sales curve?
If you have an established business, first gather at least three years of monthly sales revenue numbers.
|
The Sales Curve uses past sales data to predict future sales performance. It describes sales growth in relation to another variable over time.
How should you determine your sales curve? If you have an established business, first gather at least three years of monthly sales revenue numbers. Plug them into a spreadsheet and calculate monthly percentages. Then go back to look at each month to ensure that no significant events impacted some of the results. These could be anything from significant weather issues causing a store closing, personnel issues or even some major project or promotion that brought in better than anticipated sales for a given month. Adjust the percentage for any such event to yield a much more accurate sales curve.
Of course, if your business is new and you don’t have three years of history, the process is going to be different. You will have to rely on results from similar businesses, industry publications, and other types of professional expertise. You will have to do this as best you can to gain insight into the seasonality of your marketplace. Until you have at least three years of history, budgeting is more art than science.
Real-Life Example
Let’s look at a real-life example of a furniture store we will call XYZ Furniture. Conversations with the owner indicated that:
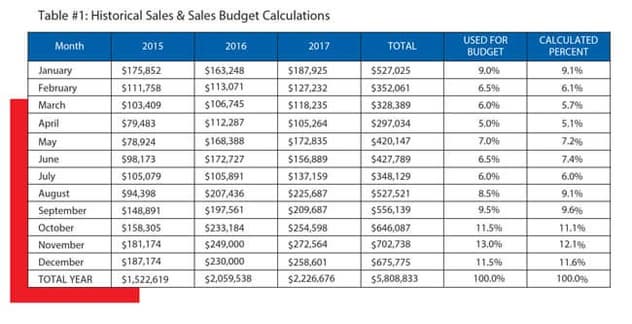
for example, we took January realized sales from 2015-2017 of
$527,025, and divided it by total sales for all three years. $527,025 / $5,808,833 = 9.1 %.
|
- Profits were up over 22 percent for 2017.
- XYZ Furniture’s CPA had suggested its owner do whatever he had to do to reduce his tax liability for 2017. The owner, therefore, over-spent in the fourth quarter on items he could have lived without to lower his tax liability.
- He paid out much bigger bonuses than originally planned.
- January 2018 sales were okay, but February and March were very disappointing.
- The owner had to reduce his own take home pay for March and tap into XYZ Furniture’s line of credit causing much stress.
Proper sales forecasting could have helped this owner to avoid stress, sleep better at night and perhaps even save his business.
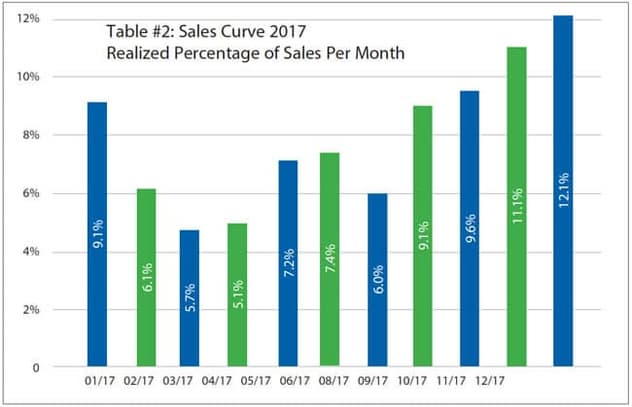
In Table #1 on page 44, sales for the past three years are listed by month. Note that total sales for 2015-2017 was $5,808,833. To find the average percentage of sales in the month of January, for example, we took January realized sales from 2015-2017 of $527,025, and divided it by total sales for all three years. $527,025 / $5,808,833 = 9.1 percent. In Table #2, budgeted amounts per month are shown graphically.
Cost Information
Once you have your sales curve established, you need to plug that information into a series of spreadsheets. These spreadsheets should include revenue and cost information for each month, each quarter, year-to-date and year-end total. Revenue from sales of product, delivery, warranties, repairs, installations, etc., will be reflected by your sales curve. Certain expenses such as rent (assuming there is no percentage rent in place) are called fixed expenses. They are not impacted by changes in revenue. Normally expenses such as advertising, commissions, etc., are variable expenses tied to revenue. Still other expenses such as utilities are variable but are tied to changes in weather.
It's obvious that projecting the timing of sales and costs is required to forecast profit and cash flow. In order to build your budget, you will need to have a chart of accounts that allows you to evaluate your business by expense center. In Table #3 you will see results for a company with a gross margin of 43.5 percent. Gross margin revenue is all of the money any company has to pay all of its operating expenses after paying for merchandise and freight.
This company has identified six expense centers, occupancy, administrative, advertising, selling, credit, and operations. The definition of each expense center is mapped out in this company’s chart of accounts.
For example, Occupancy Expense might include the categories of rent, utilities, garbage disposal, security, cleaning services/personnel, maintenance/repairs, property taxes and miscellaneous occupancy expense. Try to limit the number of accounts that you need to examine from month-to- month on your P&L.
To build your budget, you will need current and historical cost information to forecast recurring expenses. If you know that in 2018 you spent “X” number of dollars on vehicle maintenance, you can use that information to come up with a budget for 2019. You won’t necessarily plug in the same number, but use that information as a guide. The process for figuring costs is similar to the one outlined for monthly sales and should list projected expenses by month, by quarter and for the year. Having this information at your fingertips positions you to be able to compare budgeted expense amounts to your actual results. It allows you to identify variances-to-budget and from there develop company initiatives to deal with those variances.
|
The Sales Curve uses past sales data to predict future sales performance. It describes sales growth in relation to another variable over time.
|
It’s easy to just plug in arbitrary percentages for sales and cost increases. However, the more information you use to inform your numbers, the more useful your budgeting effort will be. Ideally, by the time you create your budget you will already have solidified your plans for merchandising, sales promotions, advertising and capital improvements with some certainty. Other factors beyond your control, including tariffs, the effects of an election, uncertain financial markets, and others will necessarily have to be educated guesses.
A comprehensive tutorial on how to undertake a complete budgeting process is beyond the scope of this article. But, if you are among the majority of businesses that haven’t yet undertaken formal budgeting, this article will get you started.
Experience has shown that flying by the seat of your pants is not a good long-term policy for any furniture retailer. Budgeting can help you to identify financial trends based on your monthly, quarterly and year-to-date budget numbers. Only then can you know before it’s too late if you are meeting, exceeding or missing targets for:
- sales
- gross margin percent
- advertising budget
- overall expense to revenue compared to budget and/or last year
- budgeted net profit
It’s easy to just plug in arbitrary percentages for sales and cost increases. However, the more information you use to inform your numbers, the more useful your budgeting effort will be.
Budget Meetings
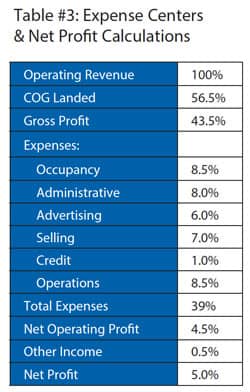 |
| Note In Table #3 (above): Operating Revenue - COG Landed = Gross Profit. Operating Revenue - (COG Landed - Total Expenses) = Net Operating Profit. |
If you take the time to create a budget, you will gain a deeper understanding of how the moving parts in your business affect profitability. But, if you don’t set up a mechanism to review performance, identify variances and plot course corrections, you will miss out on its greater power. It’s a best practice to schedule budget meetings a few days following the end of each month. What follows are some notes from an actual budget meeting that identified higher than projected expenses for a furniture retailer. Its expenses were at 43 percent of operating revenue, well above the budgeted target of 38 percent. Problem areas and remedies suggested were:
MARKETING: The original budget called for marketing expense to be five percent of operating revenue. The actual was seven percent. Marketing cost per customer opportunity was at $42.87. It was suggested that this amount be reduced by half, either by increasing traffic or cutting the budgeted amount of marketing expense to 4.5 percent. Management was concerned about where to cut marketing expense and also questioned if traffic counts would tell what effects marketing cuts might produce. Sales Management changes had already been put in place to maximize productivity from available traffic. A recommendation was made to reduce TV advertising.
WAREHOUSE: Overtime was not an issue, but the operation was overstaffed and inefficient. New management had been put in place to make adjustments.
GROSS MARGIN: It appeared relatively OK, but evidence indicated that it should be two points higher. Gross margin losses were tied to the warehouse through inadequate tracking of damages, transfers, returns, and reimbursements from a trucking company. These issues were driving higher than projected landed cost of goods. A new tracking system was being installed to get better control of these issues.
Budget Charts
Budget Example 1: This chart gives an overview of revenue, cost of goods and gross profit for a company with the month of January broken out. It's a type of chart most often found at the top portion of a budget.
Budget Example 2: This chart represents a similar view from a different company. It shows their budget for the month, actual performance, as well as variance to budget.
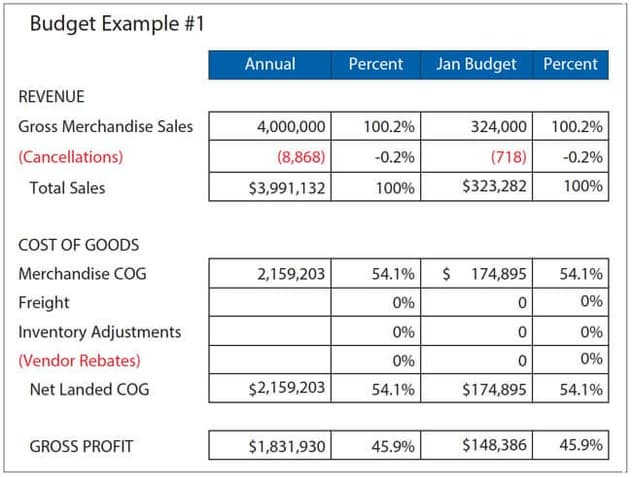 |
Budget Example #1 shows a furniture retailer's annual budget plus the month of January broken out. Freight, Inventory, and Vendor Rebates are left blank for simplicity.
|
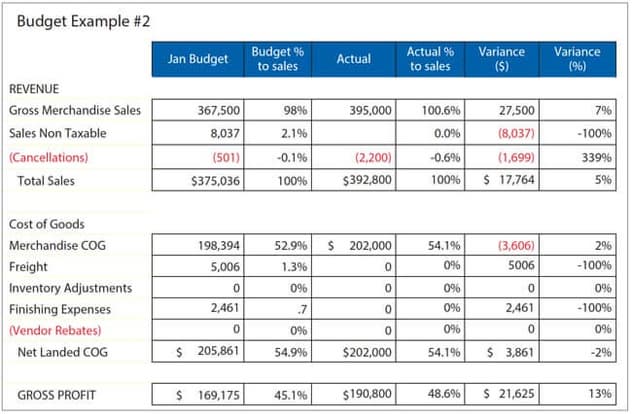 |
Budget Example #2 shows budget for the month, their actual performance, as well as variance to budget. |
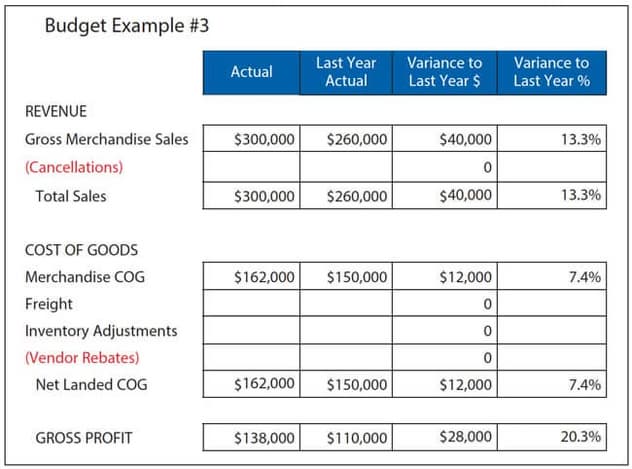 |
Budget Example #3 compares actual to last year's performance. Freight, Inventory and Vendor Rebates are left blank to simplify the example. |
Conclusion
A formal budgeting process will help you to feel more in control of your business. You will dramatically increase your ability to engineer desired results, get paid what you are worth, and take better care of your staff. You will be able to react to changes better as well.
Many home furnishings retailers are simply not strong in accounting and may rely on a partner, an employee or their CPA for accounting information. Most CPAs, however, are not strong in using numbers to run businesses. Their main function is to ensure that a business is paying their fair share of taxes, not a penny more.
Ronald Reagan was once quoted as saying “Trust but Verify”. So, whomever you use to provide this information, remember that business owners who are not able to verify are vulnerable.
You can do it! Get help to do it if needed – but do it.
More about Joe Milevsky: Joe Milevsky, CEO and founder of JRM Sales & Management, Inc., has called on his more than 40 years of industry experience, to help hundreds of clients improve the performance of their companies and profit as a result of their business relationships with JRM. Before establishing JRM 18 years ago, Joe held various executive positions with several of the strongest companies in the retail furniture industry. He has authored numerous articles for industry trade publications and he is a regular speaker at national events for the Home Furnishings Association (HFA), Hearth Patio and Barbeque Association (HPBA), Nationwide Marketing Group, and various other buying groups as well as many other organizations both domestic and international.
Questions can be directed to Joe Milevsoy at 678-574-0937 or email joe@jrmsales-mgmt.com.