Most business managers can read a Profit and Loss Statement (P&L). Sales – Merchandise Cost = Gross Margin – Expenses = Income or Loss, right? This is what people easily understand and focus on. The two other critical financial reports, Balance Sheet and the Statement of Cash Flow are often ignored or are improperly analyzed. In the last issue of Furniture World, The basics of analyzing a Profit and Loss Statement were covered. In this article, the analysis, including a furniture store specific case study, will be extended to the Balance Sheet.
If you have not read Part 1 of this series published in the January/ February issue of Furniture World Magazine, you can find it on the www.furninfo.com website at
https://www.furninfo.com/Furniture%20World%20Articles/1, or scan the QR code below to read it on your smart phone, iPad, or Android:

The Balance Sheet is also known as the Statement of Financial Position. This is because it is a snapshot at one “position” in time – usually at period end. It starts when you first opened your business, and does not end until your business is either done or sold. In contrast, the Profit and Loss Statement represents a range in time and is reset to zero each year. When the P&L is reset, your income or loss for that year is recorded as equity in your Balance Sheet’s Retained Earnings each year. If you have successive years of large profits, your equity in your business grows. The equity that you do not withdraw from the business is what helps finance the business. It is what fuels growth, longevity, and business health.
Analyzing your Balance Sheet is critical because it shows the strength of your business. It highlights the strengths and weaknesses of your financial position. The way this is accomplished is through ratio analysis. A ratio is the result comparing two different numbers. Once you calculate important ratios for your business, comparisons can be made with industry averages, peer performance groups, or historical results. By doing this, you can identify areas to focus on and track your improvement actions.
Furniture Case Study
On the following page is a Balance Sheet for the same example company used in the last issue. It is a common sized statement, meaning that along side each dollar figure is the percentage of total assets that number represents. This enables a company to compare itself with the industry and businesses of different sizes. Also included is a comparative column so that we can see the change from the previous year.
- Family owned and operated.
- Full line furniture, no electronics or appliances.
- One store operation with one detached warehouse.
- Family owns buildings separately and business pays rent.
- 25,000 square foot showroom.
- Vendor merchandising - mid to upper.
- Special order percentage = 50%.
- 2011 Sales = $5,000,000.
- 2011 Cost of Goods Sold = $2,800,000 @ 56%.
- 2011 Gross Margin = $2,200,000 @ 44%.
- 2011 Net Income After Interest and Tax = $52,000 @ 1.04%.
Note: Analysis and Select Ratios reference the red circled numbers on the sample Balance Sheet.
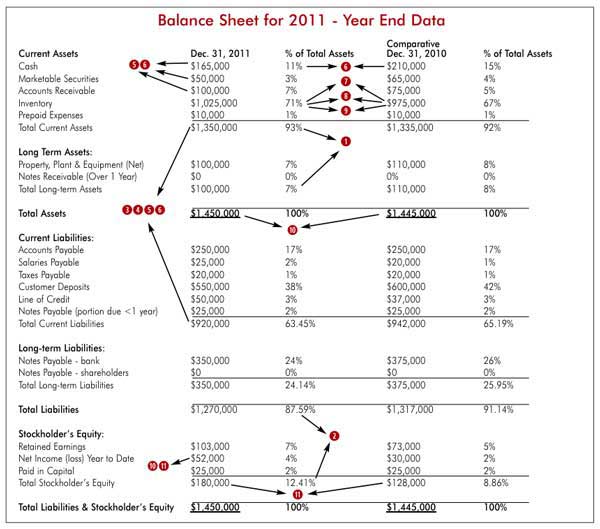
(
1) Where are the assets? 93% of their assets are current. Current means that the assets are expected to be converted into cash in less than one year. Long term assets represent only 7% of total assets. This is probably due to the fact that the owners own the buildings separately and they are paying themselves rent. This is common. This company’s health could be improved by reducing the weight of assets in inventory and accounts receivable vs. assets held in cash and securities. It would be nice to see 18-20% of total assets in Cash and Securities.
(
2) How are the assets financed? This can be seen in the per cent of total assets under liabilities and equity. This business is 12% internally financed and 88% debt financed. Their financing comes from three sources for the most part: their vendors, their customers, and their bank.
(
3) Net Working Capital $430,000. (= Current Assets – Current Liabilities.) It represents a company’s ability to pay off its short-term debt. This business seems solid when looking at working capital as a dollar amount. In cases where working capital is negative, the business will have difficulty meeting its obligations. That would be a precursor to liquidation.
(
4) Current Ratio 1.47. (= Current Assets / Current Liabilities.) Current ratio is a measure of liquidity. It gives a truer picture of the business health than net working capital as a dollar amount because it can be applied to businesses of all sizes. Although some industries are different than others, a current ratio of a 2 or 2:1 is considered decent. A current ratio of 1 would mean that the business could not pay for its debt if it became due. Here a 1.47 clearly shows there is room for improvement.
(
5) Quick Ratio .34. (= Cash + Mkt. Securities + AR / Current Liabilities.) Quick Ratio is a more conservative measure of liquidity. Inventory is a much less liquid asset, so it is removed from the equation. A Quick Ratio of .5 is considered in this industry to be decent. A .34 could be from either an inventory or debt level that is too large for its size.
(
6) Cash Ratio 23%. (= Cash + Mkt Securities / Current Liabilities.) Cash ratio is an even more conservative liquidity measure. Over 25% is good. Also note the comparative cash balance from 2010 to 2011 fell by around 20%.
(
7) Inventory Turnover 2.8 times. (= Cost of Goods (annualized) / Average Inventory.) One reason why this business is not as liquid as it could be shows itself here. Turns are lower than the industry average and much lower than the 3.5 + turns that many retailers I see are getting. A slower inventory translates itself into higher liabilities and lower cash flow.
(
8) Days Sales in Inventory 130 days. (= 365 days / Turns.) On average, it takes this business 130 days to sell and deliver a piece of merchandise. That’s tough when they have to pay their vendors in 30 days. Top operations are turning in less than 100 days. And a few retailers turn so fast, and their terms are so good, that areas of their inventory are fully vendor financed.
(
9) Gross Margin Return on Inventory (GMROI) is $2.20. (= Gross Margin Dollars (annualized) / Average Inventory.) $2.20 certainly is not bad. But it’s not great either. GMROI is the ultimate gauge of Return on Investment efficiency with inventory operations. High profit operators live at or above $2.50.
(
10) Return on Assets (ROA) 4%. (= Net income / Average Total Assets.) Like GMROI, ROA is a return ratio. This, however, compares the net income produced by the assets invested. This is one of the most telling signs of this company’s below average results in profitability. Average total assets of over $1.4 million only produced $52,000 in after tax income last year. ROA should be above 20%. A store I recently worked with had achieved almost 50% ROA!
(
11) Return on Equity (ROE) 34%. (= Net Income / Average Total Equity.) Equity for the most part is what ownership puts into the business and the profits it leaves there. It is either debt or equity that enables a business to operate and purchase and sell its assets (its inventory). Unless an owner injects a continuous stream of personal funds, equity comes from net income, period. A 34% is on the low side here. It could be due to the company being a new business, or the owners taking out profits, or in this case, it is the lack of successive high profit years. If this business takes the right actions to become a high profit operation, leave profits in the business, and uses its capital properly, this ratio should grow. As it does, its financial position will grow and its future will become brighter.
The company in this example has lots of room for improvement. Analysis of their P&L (see the previous article in the January/February issue) and their Balance Sheet here indicates that they should focus on improving some specific areas of their inventory and sales management.
They should adopt an overall goal and implement a strategy to raise GMROI from $2.20 to $2.60... just 40 cents. And per last time, they should take steps to improve their overall profitability. I would also advise that they leave some equity in the business to fund further growth.
“Well, 40 cents doesn’t sound like that much?” you might ask.
Great question! Right, 40 cents does not sound like much. Think of it this way: at $1 Million in average inventory, if this operation had 40 cents extra in GMROI, that would equate to $400,000 in extra Gross Margin dollars generated each year! Their financial position would become fantastic. That’s why it is worth it to Think Profit!